
사붐이개발일기
[모니터링] Micrometer 와 Actuator, Prometheus 와 Grafana 본문
[모니터링] Micrometer 와 Actuator, Prometheus 와 Grafana
sabeom 2024. 2. 28. 18:00Micrometer 와 Actuator
- Micrometer
- https://micometer.io/
- JVM기반의 애플리케이션 Metrics 제공
- Spring Framework 5, Spring Boot 2 부터 Spring의 Metrics 처리
- Prometheus등의 다양한 모니터링 시스템 지원
- Actuator
- Actuator란
- Actuator는 applications.yml 내 management.endpoints.web.exposure.include 라는 옵션을 통해 /actuator 페이지를 통해 노출할 엔드포인트를 설정할 수 있다.
- Actuator에 정보들이 등록되어 있어야만 Prometheus가 Metrics를 읽어올 수 있다.
- Timer
- 짧은 지연 시간, 이벤트의 사용 빈도를 측정
- 시계열로 이벤트의 시간, 호출 빈도 등을 제공
- @Timed 제공
- SpringBoot 3.x의 경우 Config파일에 Bean을 등록시켜줘야한다.
- Counter
- 시간에 따라 '증가'만하는 데이터이다. 주문수는 항상 증가한다. 중간에 감소하지 않는다.
- @Counted 제공
- SpringBoot 3.x의 경우 Config파일에 Bean을 등록시켜줘야한다.
- Actuator란
Spring Boot - Actuator 예제
- 프로젝트 환경
- Java : 17
- SpringBoot : 3.2.2
- SpringCloudVersion : 2023.0.0
buid.gradle에 의존성 주입 on user-service
dependencies {
	// Actuator에 정보들이 등록되어야 Prometheus가 읽어올 수 있음
	implementation 'org.springframework.boot:spring-boot-starter-actuator'
	// Prometheus
	implementation 'io.micrometer:micrometer-registry-prometheus'
}
application.yml 설정 추가 on user-service
management:
  endpoints:
    web:
      exposure:
        include: metrics, prometheus
UserController에 짧은 지연 시간, 이벤트의 사용 빈도를 측정이 필요하면 @Timed 추가 on user-service
@RestController
@RequestMapping("/")
public class UserController {

	@GetMapping("/health_check")
	@Timed(value = "users.status", longTask = true)
	public String status() {
		return String.format("It's Working in User Service"
			+ ", port(local.server.port)=" + env.getProperty("local.server.port")
			+ ", port(server.port)=" + env.getProperty("server.port")
			+ ", token secret=" + env.getProperty("token.secret")
			+ ", token expiration time=" + env.getProperty("token.expiration_time"));
	}
}ERROR: SpringBoot 3.x의 경우 Config파일로 Bean을 등록시켜야 @Timed 와 @Counted를 사용 가능 on user-service
@Configuration
@EnableAspectJAutoProxy
public class MetricsConfig {

    @Bean
    public CountedAspect countedAspect(MeterRegistry meterRegistry) {
        return new CountedAspect(meterRegistry);
    }

    @Bean
    public TimedAspect timedAspect(MeterRegistry meterRegistry) {
        return new TimedAspect(meterRegistry);
    }
}
application.yml에서 Actuator URL 경로 열기 on apigateway-service
spring:
  cloud:
    gateway:
      routes:
        # Actuator
        - id: user-service
          uri: lb://USER-SERVICE
          predicates:
            - Path=/user-service/actuator/**
            - Method=GET, POST
          filters:
            - RemoveRequestHeader=Cookie  # GET으로 들어온값은 매번 새로운 데이터처럼 인식하게 만들기 위해 requestHeader값 초기화
            - RewritePath=/user-service/(?<segment>.*), /$\{segment}  # url_path 재정의

        - id: order-service
          uri: lb://ORDER-SERVICE
          predicates:
            - Path=/user-service/actuator/**
            - Method=GET, POST
          filters:
            - RemoveRequestHeader=Cookie  # GET으로 들어온값은 매번 새로운 데이터처럼 인식하게 만들기 위해 requestHeader값 초기화
            - RewritePath=/order-service/(?<segment>.*), /$\{segment}  # url_path 재정의
serverIP:port/actuator/metrics 에서 @Timed에 등록한 'users.status' 확인하기 on web-browser
(ex. http://122.xxx.232.xxx:56959/actuator/metrics )
{
    "names": [
        "application.ready.time",
        "application.started.time",
        ...
        "users.status",
        "users.welcome"
    ]
}
Prometheus 와 Grafana
- Prometheus
- Metrics를 수집하고 모니터링 및 알람에 사용되는 오픈소스 애플리케이션
- 2016년부터 CNCF에서 관리되는 2번째 공식 프로젝트
- Level DB → Time Series Database(TSDB)
- Pull 방식의 구조와 다양한 Metric Exporter 제공
- 시계열 DB에 Metrics 저장 → 조회 가능 (Query)
- Grafana
- 데이터 시각화, 모니터링 및 분석을 위한 오픈소스 애플리케이션
- 시계열 데이터를 시각화하기 위한 대시보드 제공
Prometheus 설치
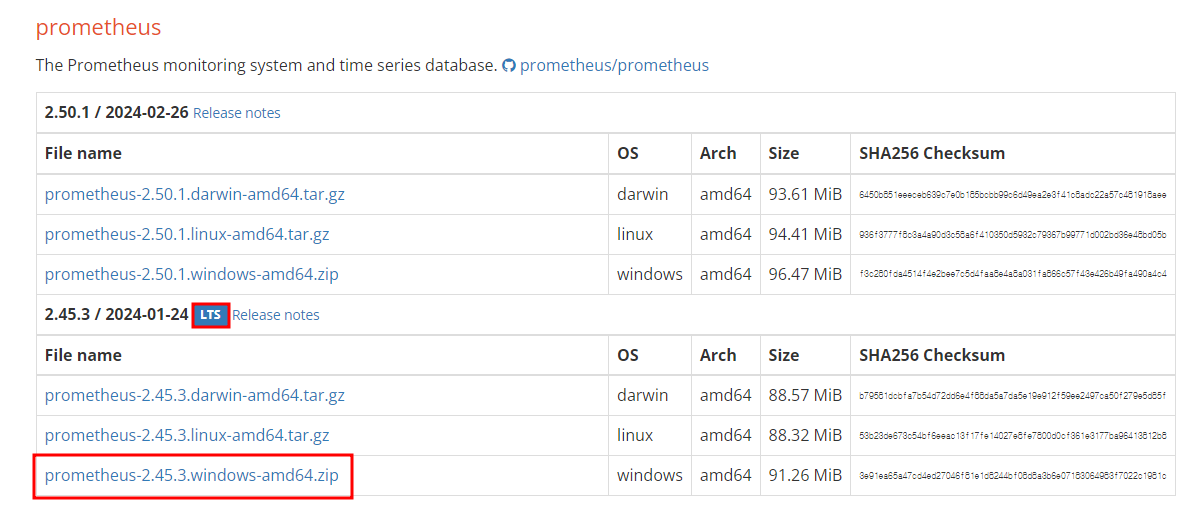
Prometheus 다운 링크 : https://prometheus.io/download/
압축 풀기
// mac
tar xvzf prometheus-2.25.0.darwin-amd64.tar.gz
// windows
tar xvzf .\prometheus-2.45.3.windows-amd64.zip
prometheus.yml 설정 추가 on 프로메테우스-폴더/prometheus.yml
scrape_configs:
  # The job name is added as a label `job=<job_name>` to any timeseries scraped from this config.
  - job_name: "prometheus"

    # metrics_path defaults to '/metrics'
    # scheme defaults to 'http'.

    static_configs:
      - targets: ["localhost:9090"]

  # 프로메테우스 이외에 추가적인 Job을 등록해 사용할 수 있다.
  - job_name: 'user-service'
    scrape_interval: 15s  # 15초 간격
    metrics_path: '/user-service/actuator/prometheus' # 이전에 추가시켰던 actuator의 수집된 정보를 가지고와서 prometheus가 시계화 데이터베이스로 저장한다.
    static_configs:
    - targets: ['localhost:8000'] # 어느 서버에서 가져올지 타겟을 결정

    # 프로메테우스 이외에 추가적인 Job을 등록해 사용할 수 있다.
  - job_name: 'order-service'
    scrape_interval: 15s  # 15초 간격
    metrics_path: '/order-service/actuator/prometheus' # 이전에 추가시켰던 actuator의 수집된 정보를 가지고와서 prometheus가 시계화 데이터베이스로 저장한다.
    static_configs:
    - targets: ['localhost:8000'] # 어느 서버에서 가져올지 타겟을 결정

  # 프로메테우스 이외에 추가적인 Job을 등록해 사용할 수 있다.
  - job_name: 'apigateway-service'
    scrape_interval: 15s  # 15초 간격
    metrics_path: '/actuator/prometheus' # 이전에 추가시켰던 actuator의 수집된 정보를 가지고와서 prometheus가 시계화 데이터베이스로 저장한다.
    static_configs:
    - targets: ['localhost:8000'] # 어느 서버에서 가져올지 타겟을 결정
프로메테우스 실행하기
// MacOS
./prometheus --config.file=prometheus.yml
// Windows
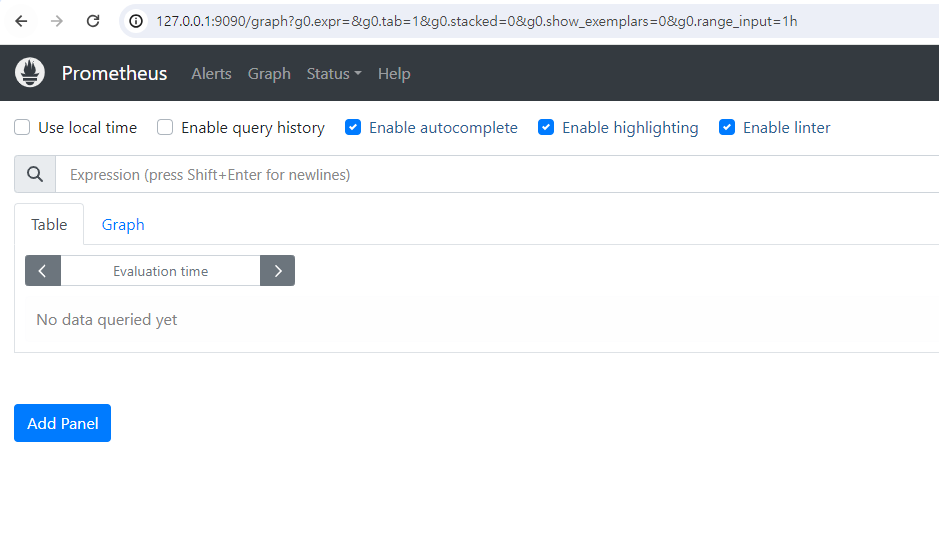
.\prometheus.exe프로메테우스 확인하기 (ex. 127.0.0.1:9090)
Grafana 설치
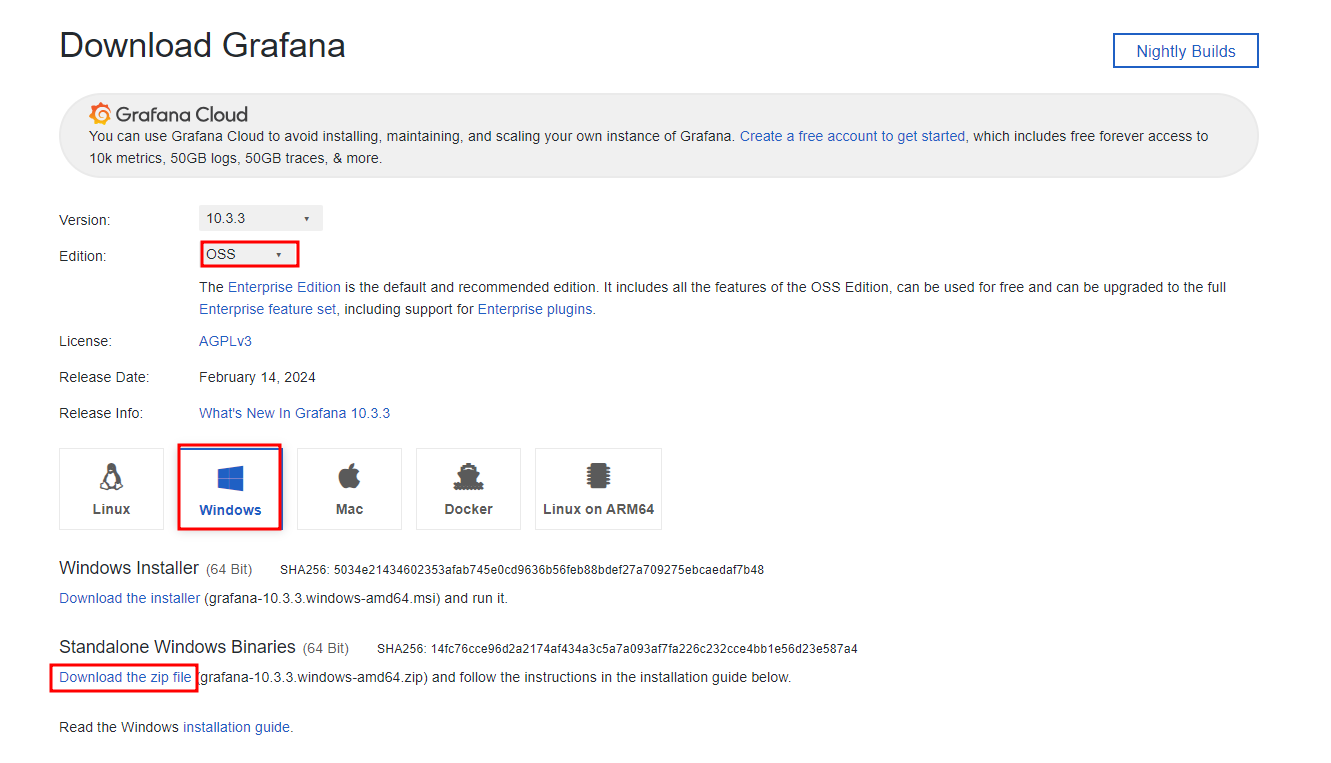
Grafana 다운 링크 : https://grafana.com/grafana/download
압축 풀기
// mac os
tar xvzf grafana-7.4.3.drwin-amd64.tar.gz
// windows
tar xvzf .\grafana-10.3.3.windows-amd64.zip
그라파나 실행하기
// MacOS
./bin/grafana-server
// Windows
.\bin\grafana-server.exe
그라파나 확인하기 (ex. 127.0.0.1:3000)
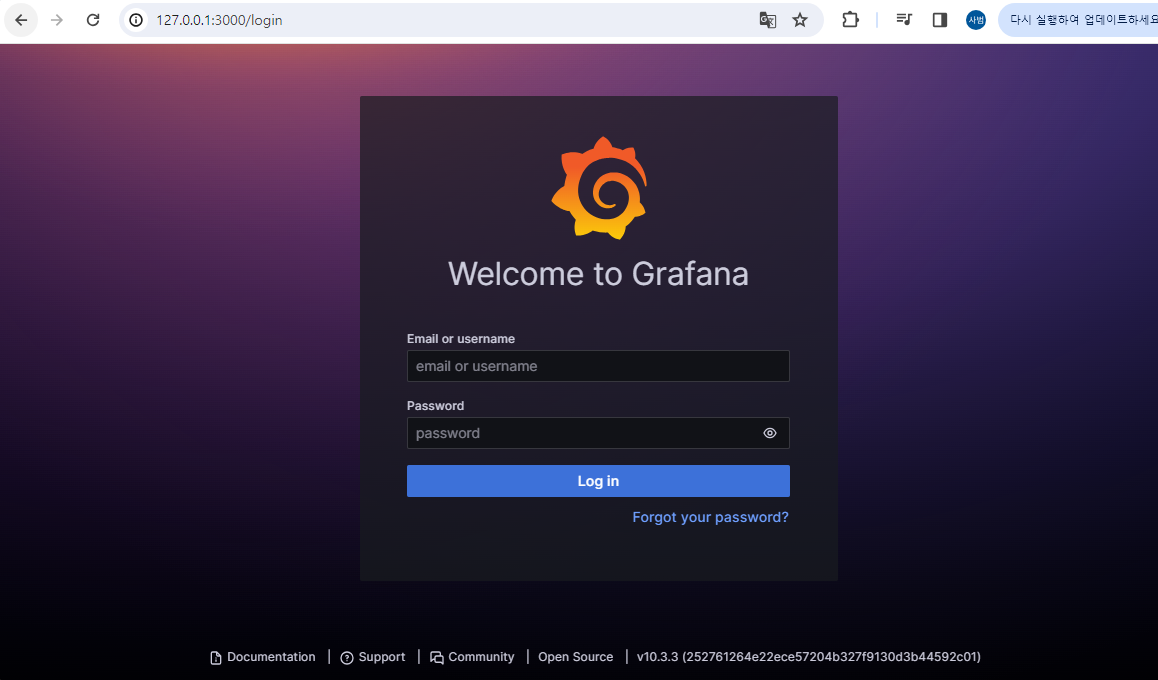
로그인 하기
- User ID : admin (default)
- User PW : admin (default)
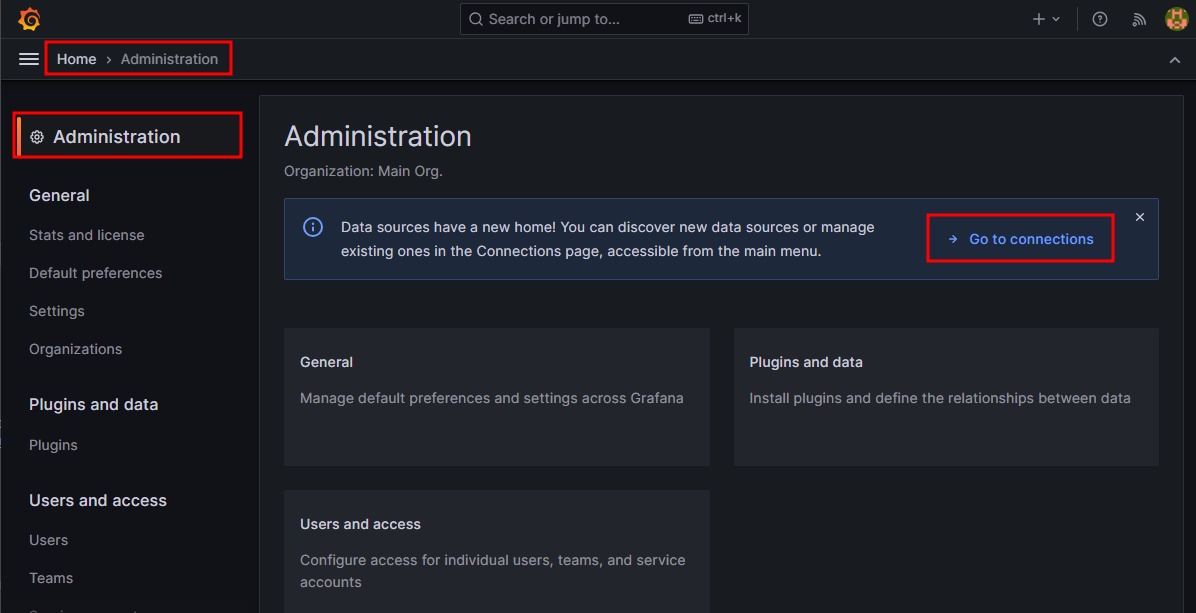
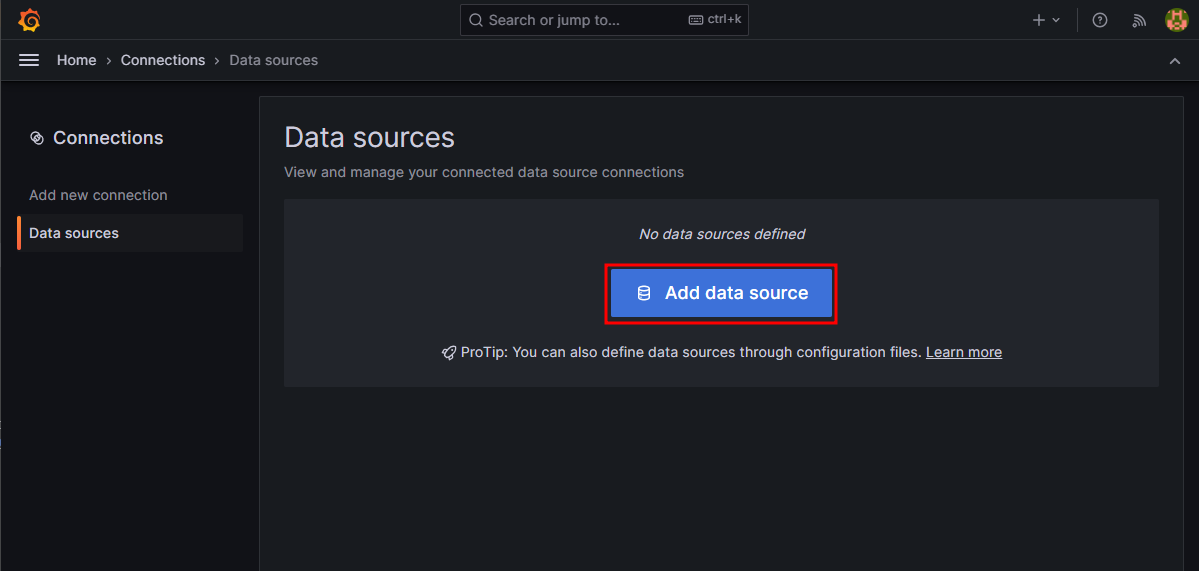
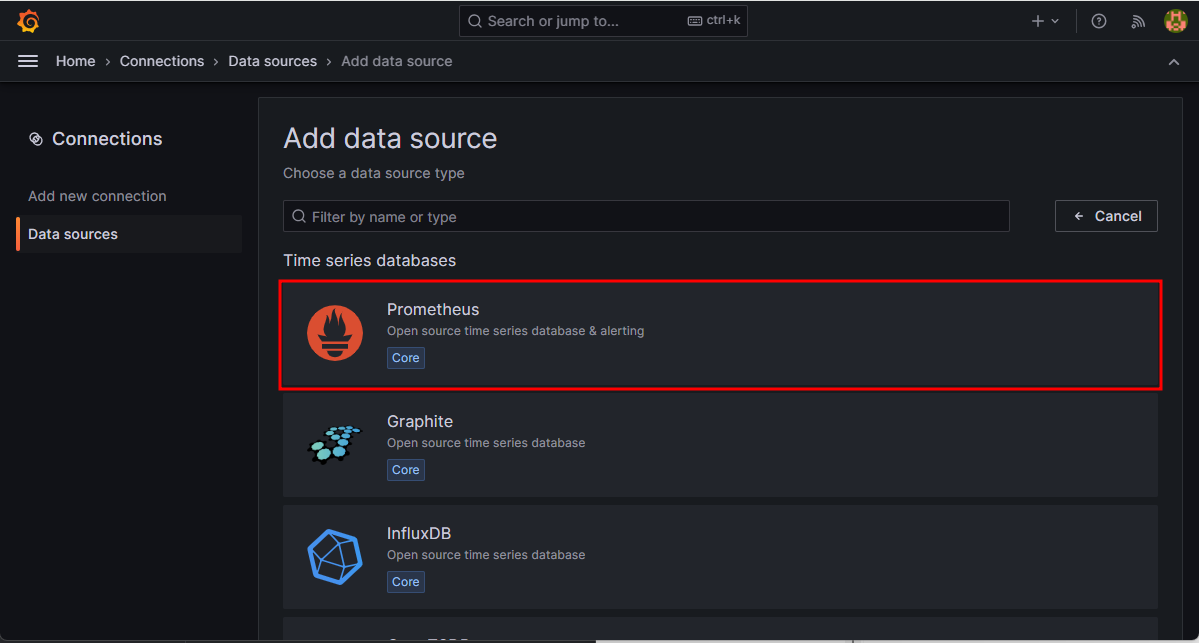
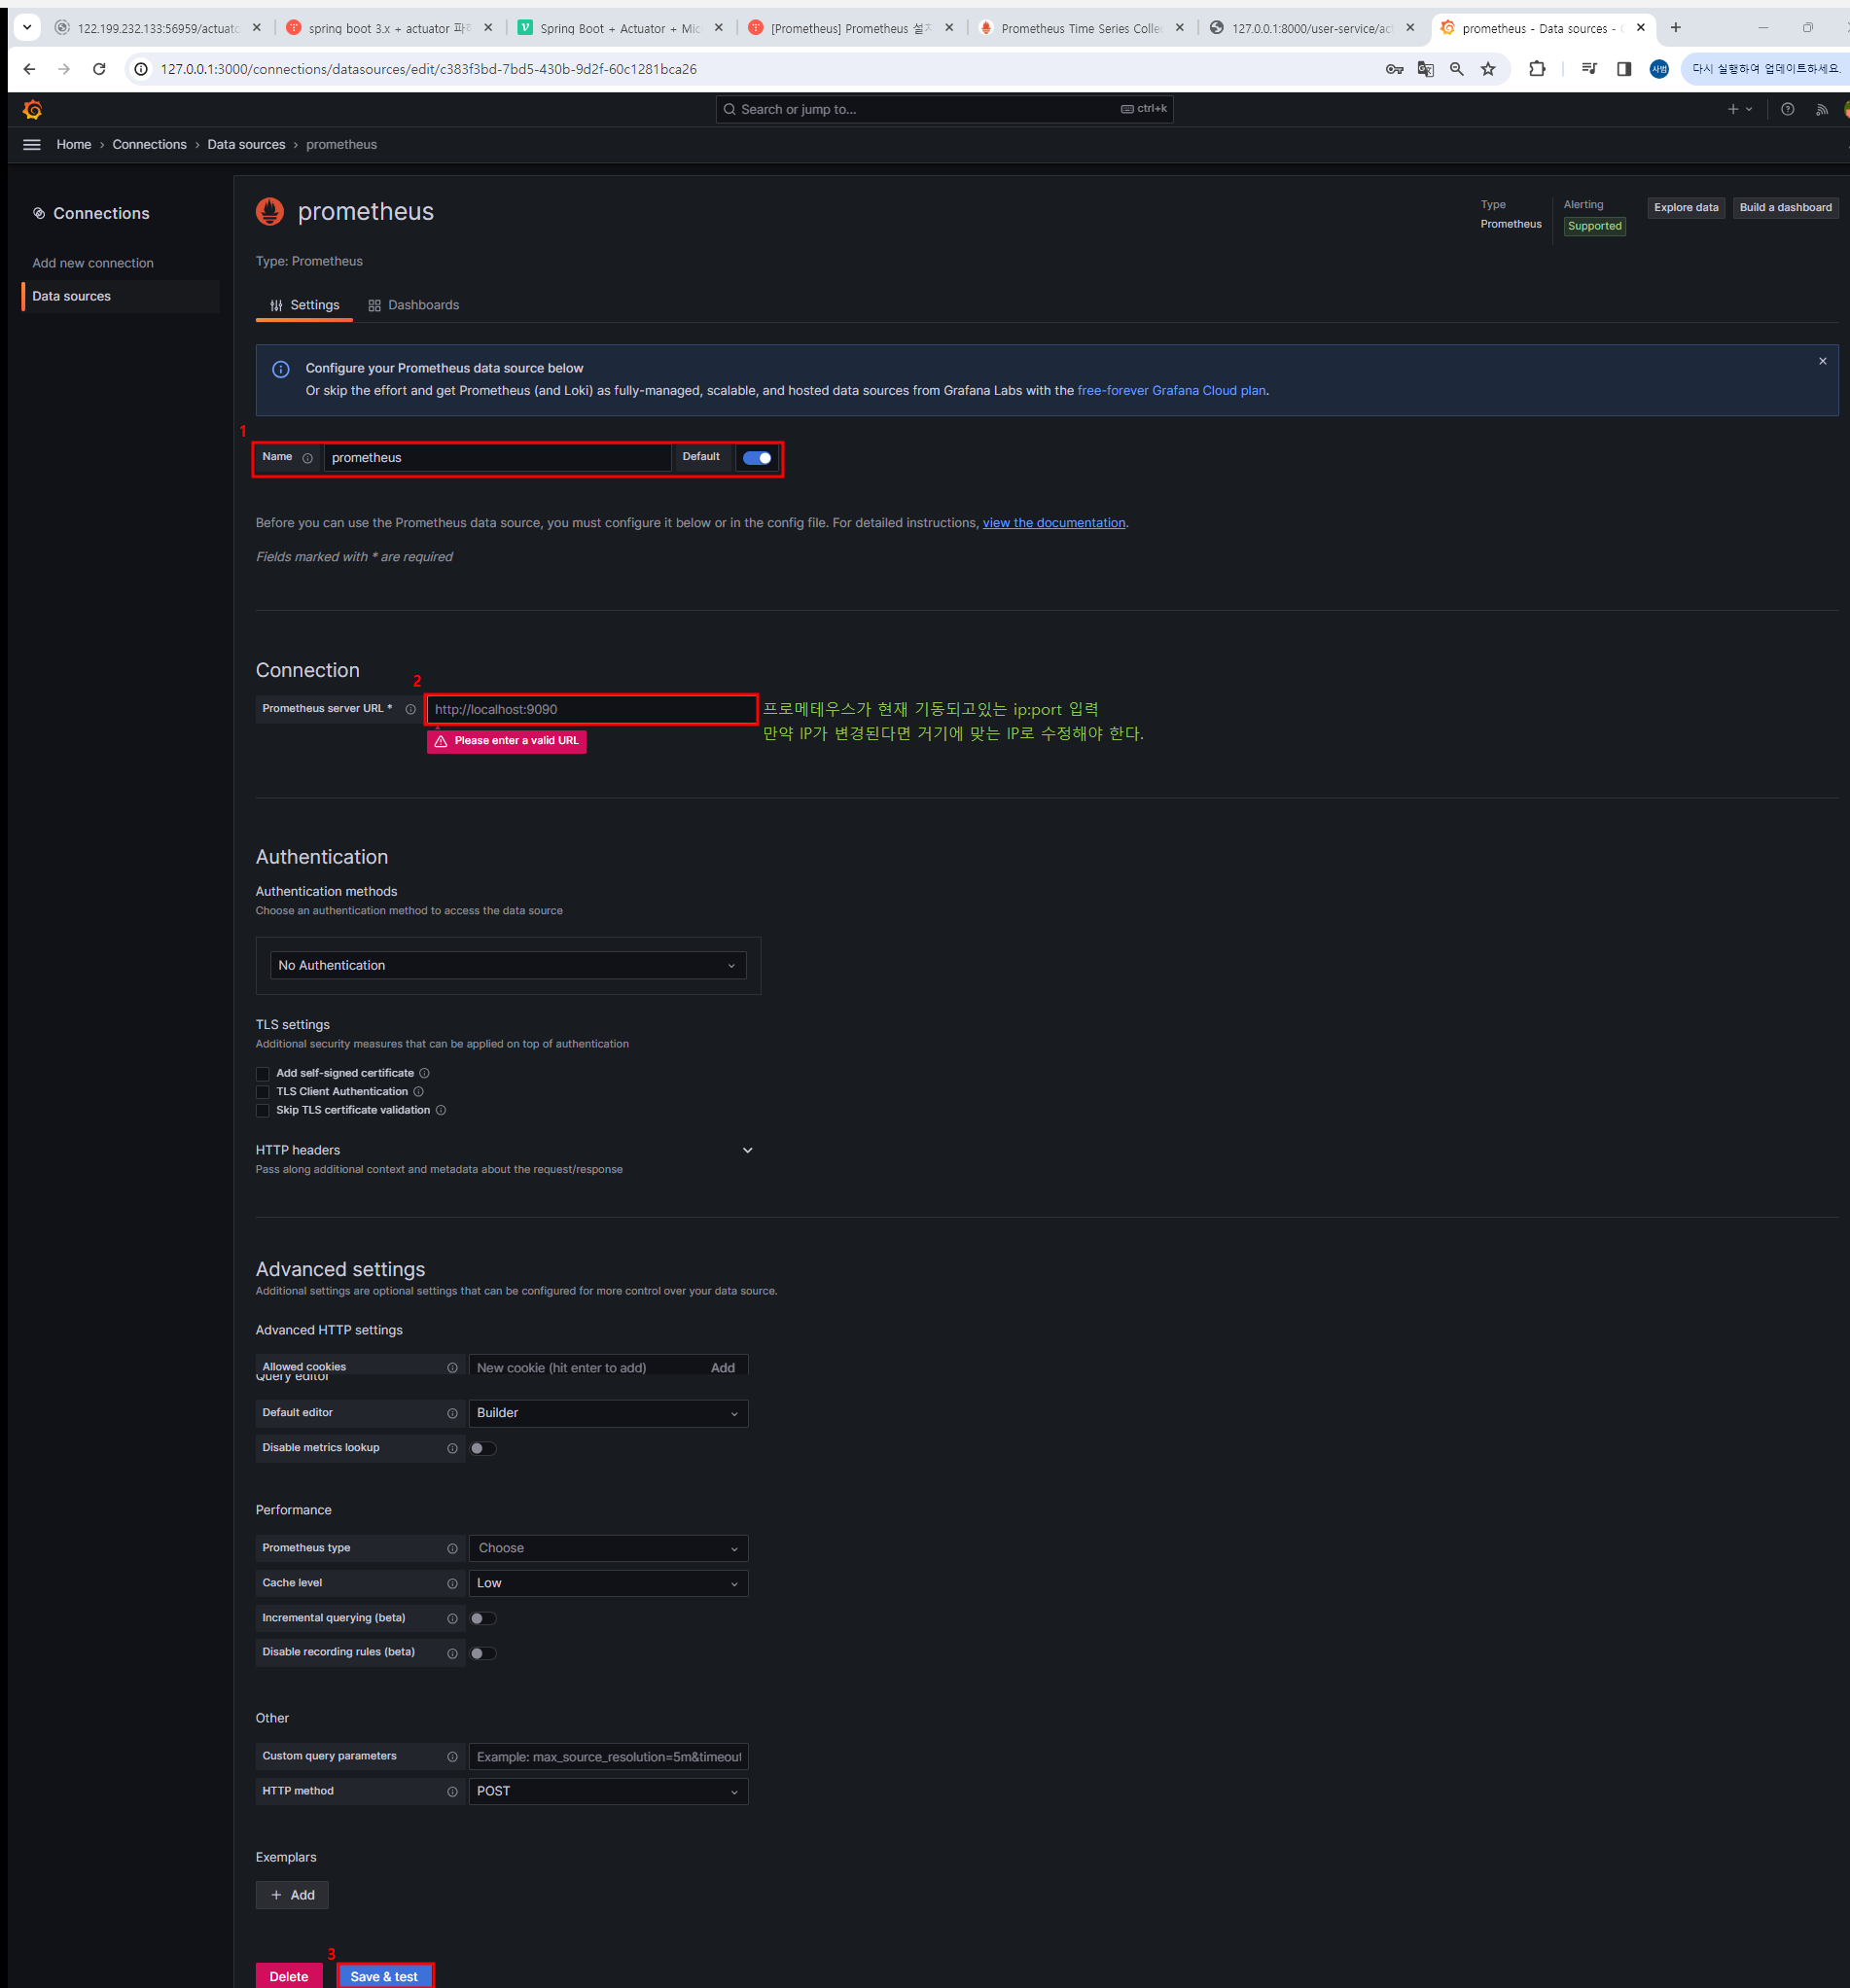
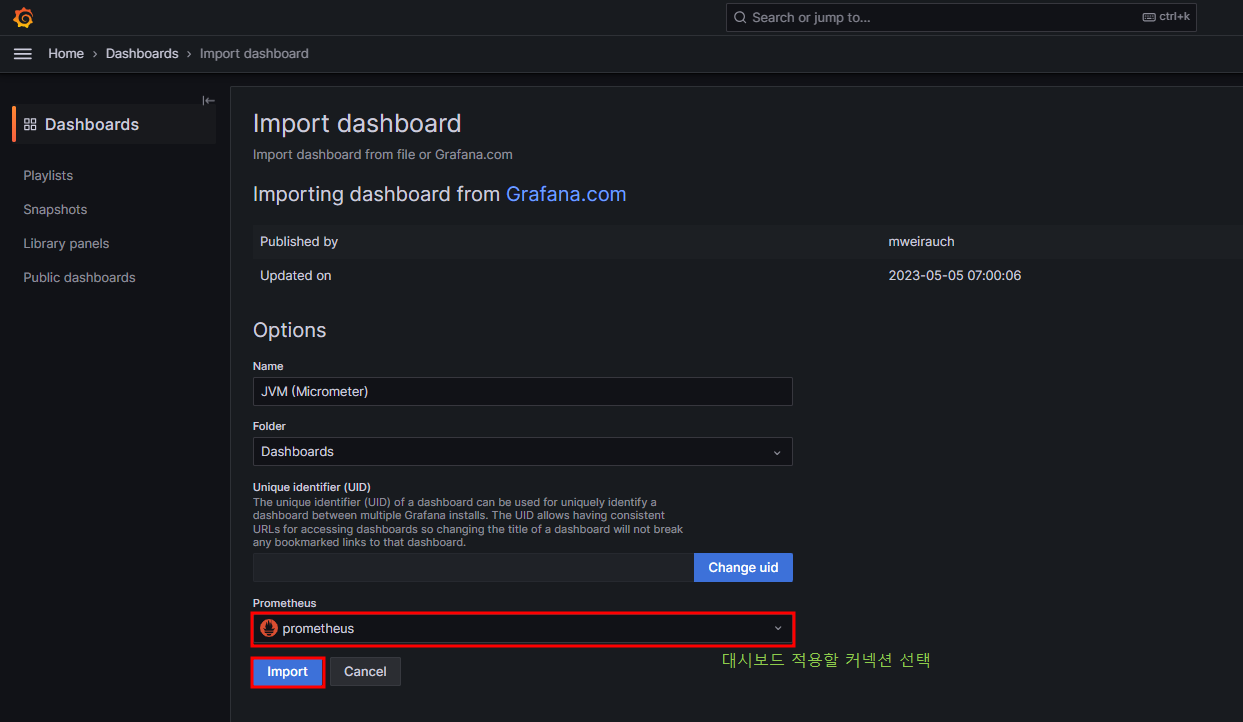
Prometeus와 Grafana 연동하기
Grafana Dashboard 등록
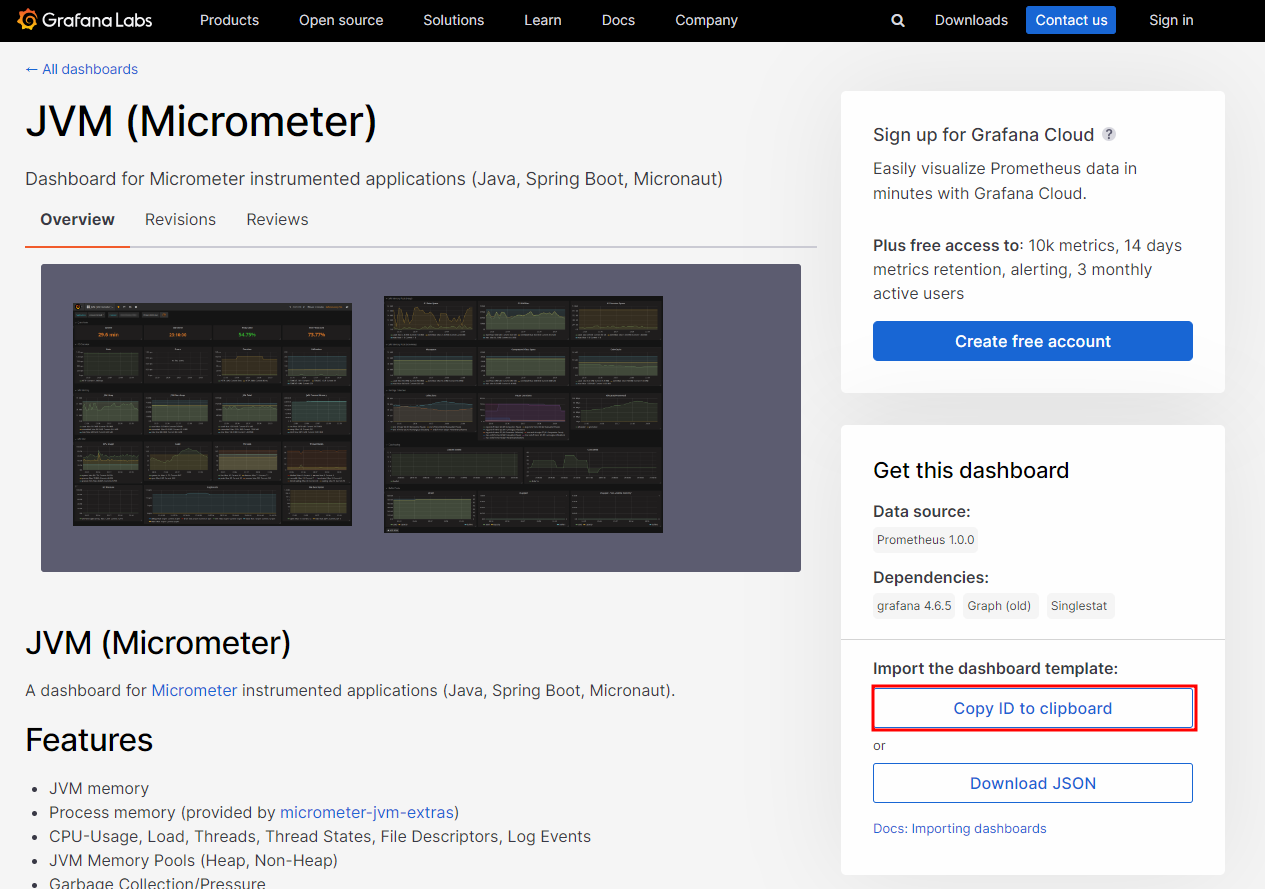
- JVM(Micrometer)
- micrometer를 확인하기위한 JVM 대시보드
- Prometheus
- 프로메테우스에 대한 정보, 프로메테우스도 하나의 서버이기 때문에 가지고 있는 리소스를 파악하기위한 대시보드
- Spring Cloud Gateway
- 마이크로서비스들이 어떤 리소스를 가지고있고 호출되고있는지 도식화시켜서 확인
커넥션 생성
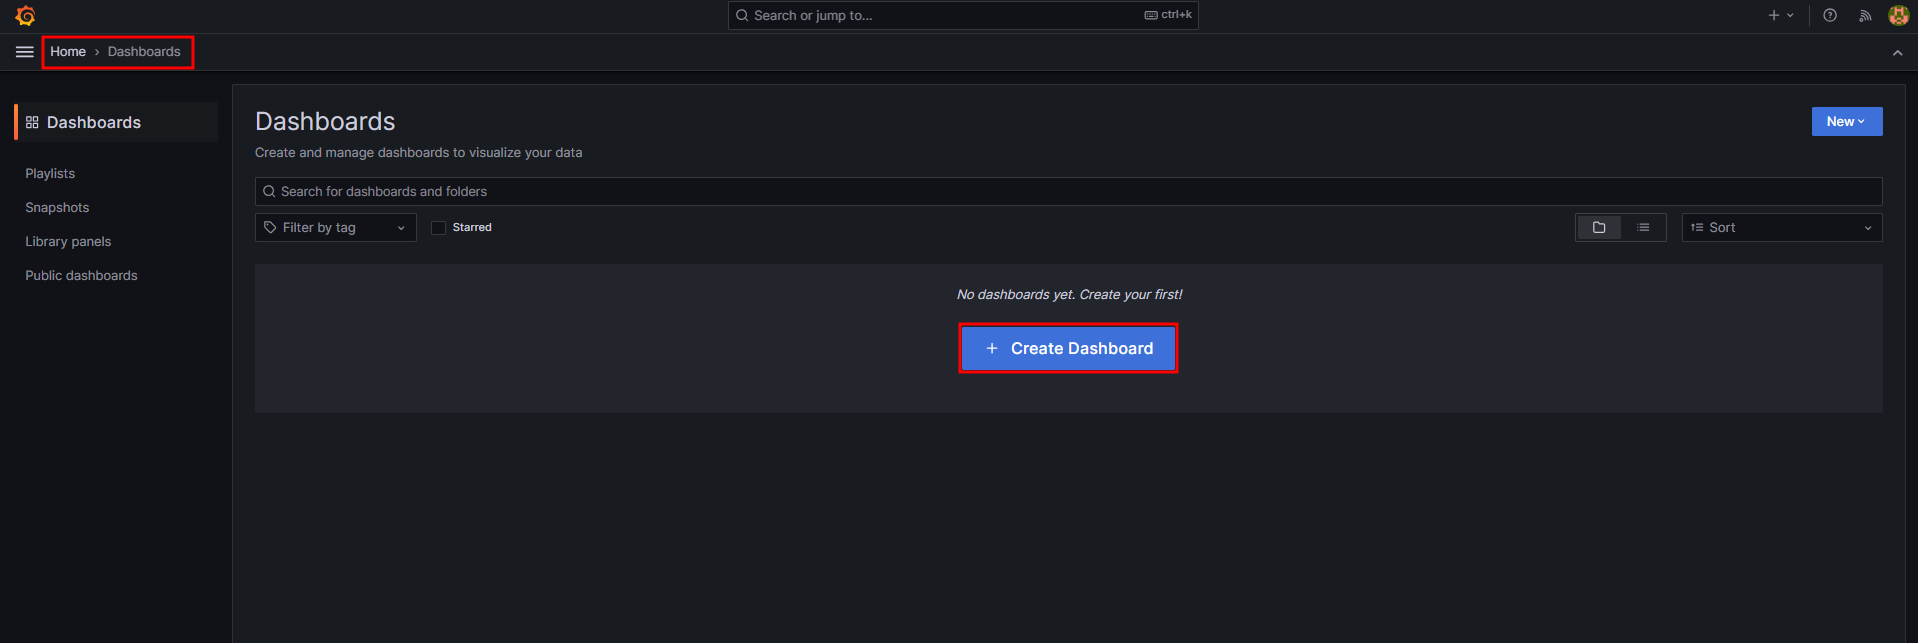
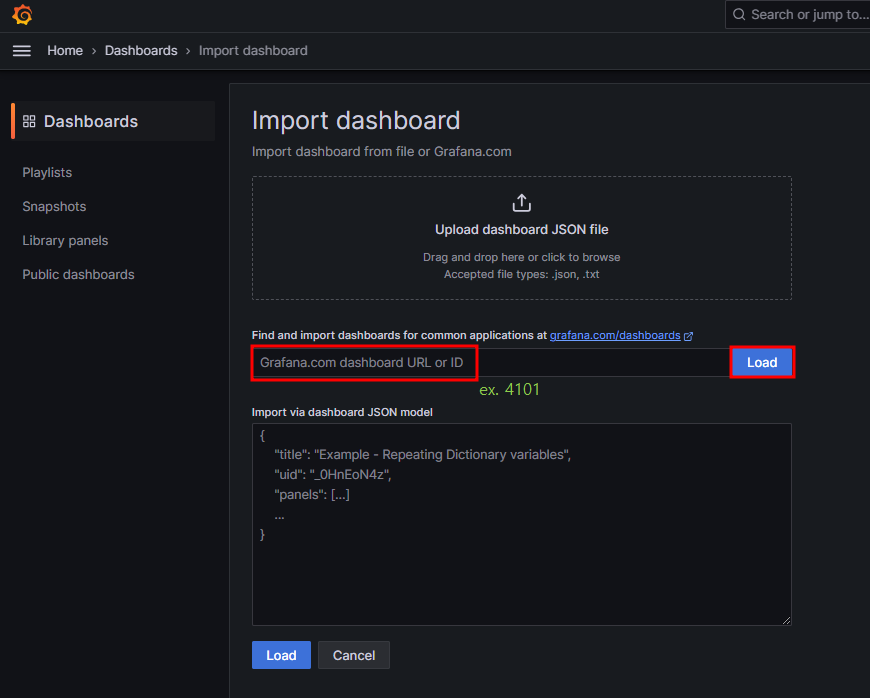
대시보드 생성
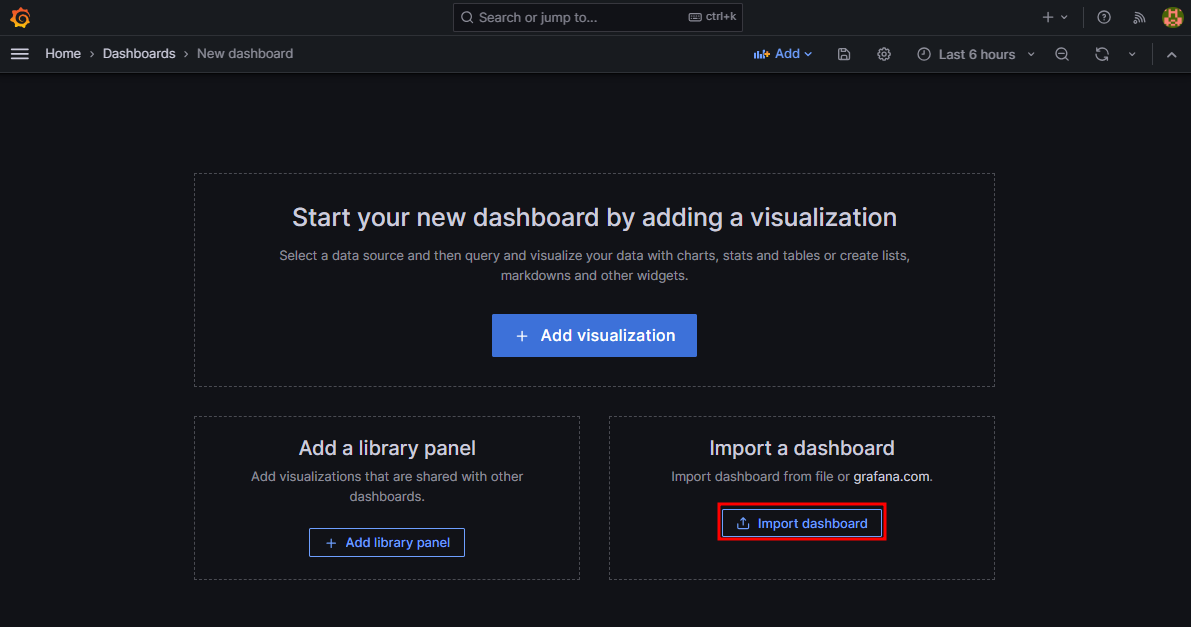
그라파나 대시보드에서 맘에드는 플러그인 다운로드
https://grafana.com/grafana/dashboards/
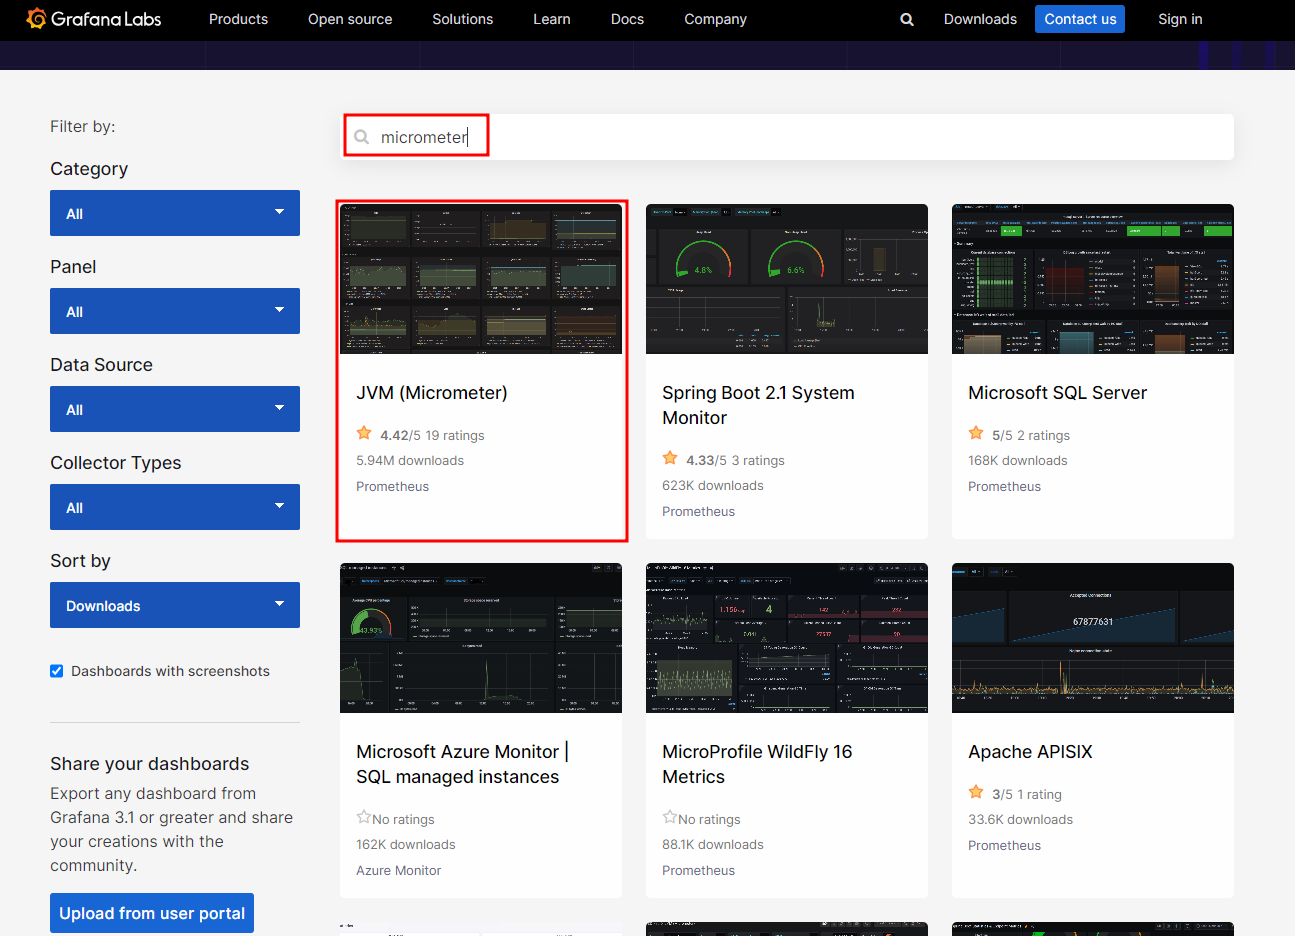
JVM Dashboard
https://grafana.com/grafana/dashboards/4701-jvm-micrometer/
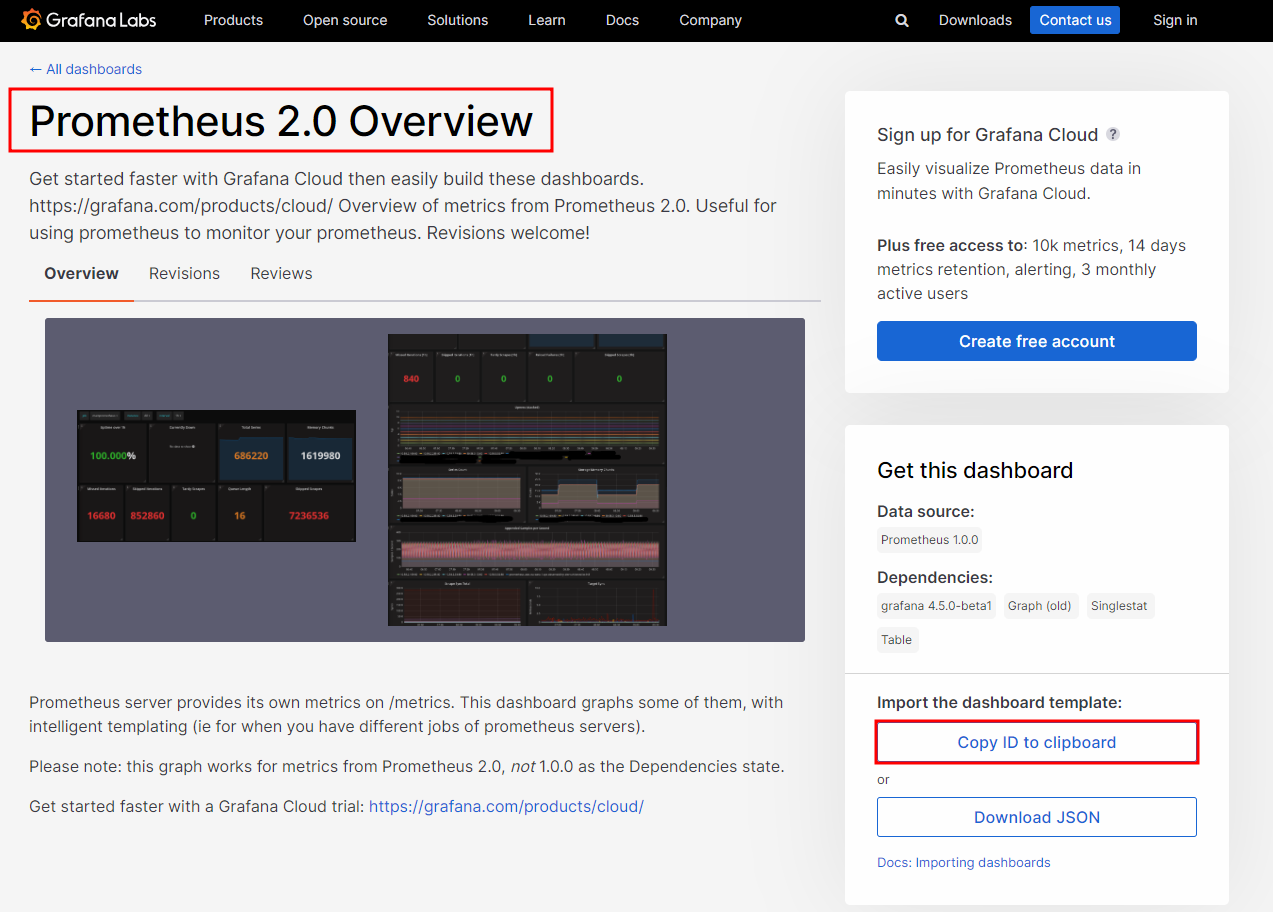
프로메테우스 자체 리소스만 확인할 수 있는 대시보드도 생성하기
https://grafana.com/grafana/dashboards/3662-prometheus-2-0-overview/
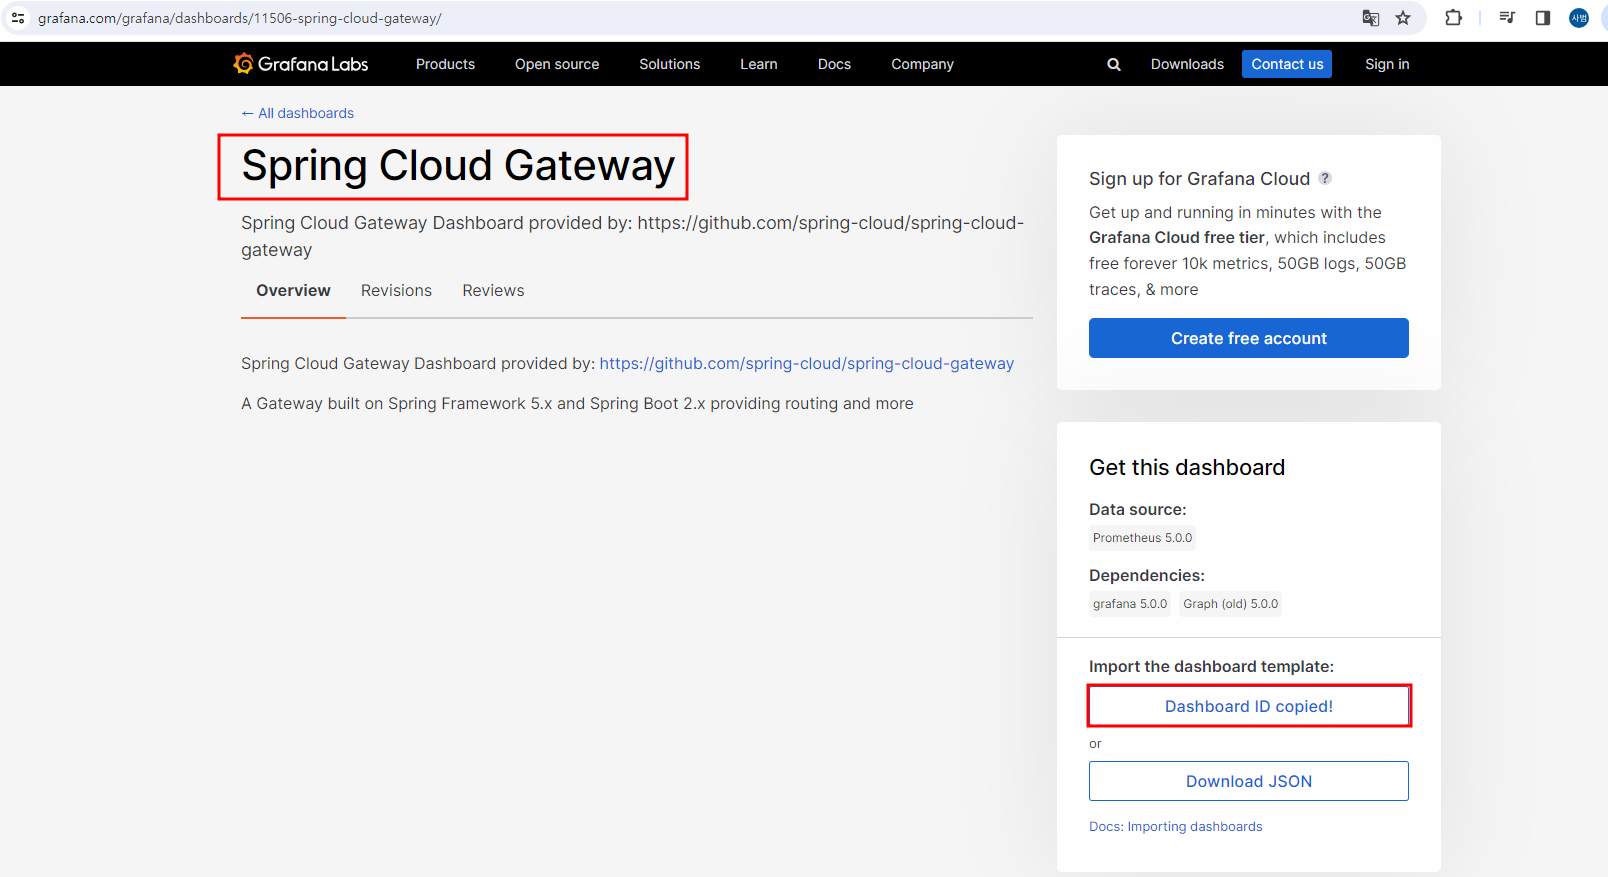
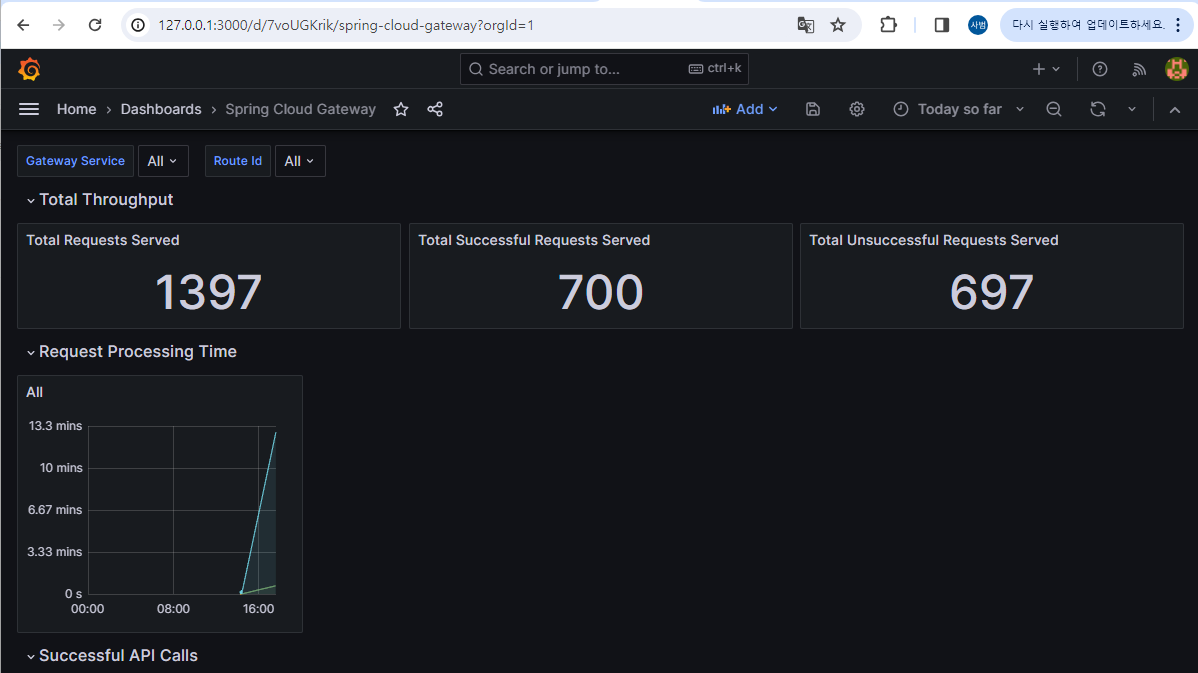
Spring Cloud Gateway Dashboard 생성하기
https://grafana.com/grafana/dashboards/11506-spring-cloud-gateway/
ERROR: Spring Cloud Gateway는 대시보드 생성시 값들이 비어있을 것이다.
Spring Boot 버전이 올라감에 따라 초기에 설정된 값들과 매칭이 안되기 때문이다.
따라서 값들을 직접 매핑 해주어야한다.
- Total Requests Served
- gateway_requests_seconds_count → spring_cloud_gateway_requests_seconds_count
- All Success API Gateway Calls
- gateway_requests_seconds_count → spring_cloud_gateway_requests_seconds_count
- routeId=~"$routeId" → routeId=~"user-service" ,
routeId=~"$routeId" → routeId=~"order-service" ,
routeId=~"$routeId" → routeId=~"catalog-service" , - job=~"$gatewayService" → job=~"apigateway-service"
- Live Threads
- jvm_threads_live{job=~"$gatewayService"} → jvm_threads_live_threads{job=~"apigateway-service"}
'인프런 > [Spring Cloud] MSA-이도원' 카테고리의 다른 글
| [Microservice 분산추적] Zipkin 과 Spring Cloud Sleuth (0) | 2024.02.27 |
|---|---|
| [FeignClient 장애처리] CircuitBreaker - Resilience4J 사용 (0) | 2024.02.27 |
| [Spring Cloud Bus AMQP] 섹션8. RabbitMQ 설치 - 윈도우10 (0) | 2024.02.23 |
| [Kafka] 데이터 동기화를 위한 Apache Kafka의 활용 (0) | 2023.12.27 |
| [MSA] Microservice간 통신 (RestTemplate, FeignClient, 예외처리) (0) | 2023.12.26 |


